วันศุกร์ที่ 27 กรกฎาคม พ.ศ. 2550

Information Crackdown

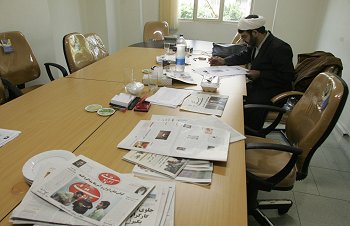
An Iranian cleric journalist works at the offices the reformist daily Etemad-Malli's offices in Tehran. The offices of the newspaper were attacked overnight and its entrance blown up, according to the paper's public relations officer. Launched in Feb. 2006, Etemad-Melli is published by Mehdi Karrubi, a reformist cleric and a presidential hopeful of the June 2005 election. (Photo: Atta Kenare / AFP-Getty Images)

It was less than a decade ago that for the first time in years, Iranians began to feel the intoxicating breeze of long-denied basic civil rights — foremost among them, the right to express themselves and the right to know.

In the summer of 1997, more than 20 million Iranians — the majority of them long-oppressed youth and women — wrote on their ballots the one name that they felt could make their wildest dreams come true in bringing back "freedom" to their lives, Mohammad Khatami.

With his ascension to the presidency, the reformist Khatami began to fulfill many of his vows: the massive social suppression on the youth began to fade away; the banned books got published; banned movies were screened and theaters were filled; concerts and other cultural gatherings such as festivals were held; and perhaps most significantly of all, the concept of a "free press" was revived.


Tens of different newspapers and journals emerged, produced by long-suppressed journalists and elites. Major policies were criticized, debates were held, and most surprising to Iranians the president remained supportive.

Following the basic changes that were taking place in the political, social, and cultural arenas in Iran, the critics then took the opportunity to focus on what they saw as the fundamental factor behind the Islamic Republic's anti-democratic charter — absolute dominance of a supreme leader, Ayatollah Ali Khamenei.

The red line had been crossed.

More than 100 pro-reformist publications were shut down by the direct order of Khamenei, journalists were put in prison, the student movement was brutally cracked down upon, and activists were suppressed, even murdered. Khatami himself paid a price in the challenge over the freedom of expression — his major reform adviser, Saeed Hajjarian, was assassinated, his culture minister was forced to resign, and his minister of internal affairs was jailed.

The major fight over the reforms had begun.

During the two terms of Khatami's presidency, although the suppression of the press resulted in the closure of hundreds of papers, still the spirit of the movement was kept alive by substitute journals that kept emerging after others had been shut down.

But the eight years passed quickly. Khatami and his reformist allies were put away and a new face filled the president's office in Tehran — Mahmoud Ahmadinejad. With ascension of Ahmadinejad, which unlike Khatami's victory was warmly greeted by the supreme leader and other "behind the scenes" figures, many worried that the then relatively free cultural environment of Iran would revert back into its dark times.

Their worries came true.

At the beginning it seemed like the routine crackdown on journalists that Iranians had become accustomed to, but then the fundamental curbs on free speech revealed that it had much more to it. Ahmadinejad's hard-line government which now was granted the full support of the leadership began a systematic crackdown, not only on the press, but also on every other existent avenue of information — books, satellite television, and most significantly, the Internet.

This time it was not only about dissidents who opposed the system; it was what one might call, "a major battle with the free flow of information."

The Internet

The first and most telling example of the crackdown on information can be found in the overt intolerance shown toward Internet-related activities, and the heavy, unusual methods used to confine users.

In the latest unexpected policy action, Iran's Internet service providers (ISPs) have started reducing the speed of Internet access to homes and cafes based on new government-imposed limits — a move critics said appeared to be part of the clampdown on the media. An official said last week that ISPs were now "forbidden" by the Telecommunications Ministry from providing Internet connections faster than 128 kilobytes per second (kbps), as reported by the official IRNA news agency. The official did not give a reason.

Internet technicians say speeds of 256 kbps, 512 kbps, or higher are increasingly common internationally. Iranian surfers will now find the Web much slower, especially to download audio and video files.

This new decision is apparently much wider in scope than the previous policy of suppression and intimidation. It can also be considered among the first times that the Iranian government has overtly denied its people from accessing "technology" in favor of censorship.

An Iranian Internet engineer, who asked not to be identified, said his firm had started reducing speeds provided to homes and Internet cafes, but not businesses. The Telecommunications Ministry official said the order would stay in place until "new regulations for providing ADSL (high-speed Internet) services" were issued, IRNA reported.

It was not clear if this meant the restrictions were only temporary, but another ISP official said he expected them to stay in place. He said his firm had yet to be officially informed of the new order but was starting to impose the limitations on customers anyway, "because we are not looking for trouble."

Filtering and site-blocking had so far been the most advanced method of 'net limitation in Iran, with more than 10 million Web sites being currently filtered. Discussing the policy on Sept. 11, Ismail Radkani, the director-general for Management and Technical Support at the state Information Technology Company, noted that the filtering software database is updated automatically on a daily basis.

Ramazanali Sadeqzadeh, a legislator from the northern city of Rasht, explained that a small committee in the Supreme Cultural Revolution Council monitors the filtering of Web sites. The committee consists of personnel from the Intelligence and Security Ministry, the Islamic Culture and Guidance Ministry, and Islamic Republic of Iran Broadcasting. Its decision to filter a site is relayed to the Communication and Information Technology Ministry.

It should be noted that Ahmadinejad's fundamentalist administration did not initiate efforts to filter the Internet. The policy, in fact, got underway during the Khatami presidency. At that time, however, control of Internet activities was initially connected with the state's effort to reverse losses in telecommunication revenues, and only later was it related to control of information and expression.

It was not until May 2006 and the Ahmadinejad presidency that the Communication and Information Technology Ministry announced the creation of a central filtering site. According to initial reports, this facility would block access to unauthorized Web sites, identify Internet users, and keep a record of the sites they visited. The system administrator would have access to all the noted information.

The ministry subsequently denied that the filtering facility could identify users and track their browsing habits, and it stressed that it only wants to block access to pornography.

Technology Minister Soleimani announced on April 19 that a "national Internet will be established this year," state television reported. The characteristics of the so-called "national Internet" has not yet been specified, but the main objective of the promised program will be a drastic cut-off from the global media.

Although the new technological crackdown on the Internet seems to be the preferable method of the Islamic Republic of Iran to suppress the digital flow of information, related arrests and interrogations still continue.

In the past six months at least five bloggers and Web site managers have been prosecuted in Iran. Furthermore, on Oct. 21 the state-run IRNA news agency reported that the deputy prosecutor of Tehran had announced the establishment of a special court for Internet "crimes."

Foreign-based Persian and English news Web sites are the most used sources of information by the majority of Iran's young population. According to Iranian officials, the country has more than 11 million Internet users, and Persian is among the most blogged languages on the World Wide Web.

The Press

The press, as the most traditional target of suppression against the flow of information in Iran, has had the most casualties in the new crackdown. During the spring and summer of 2006 more than 29 cases of prosecutions against journalists, 35 cases involving editors, and 8 cases of confiscation of press materials have been filed.

The most recent such press-ban order was issued for the Roozegar newspaper, which many believed was going to replace the newly-closed pro-reform Shargh daily.

Roozegar was banned after only six days of publication on the charges that its logo resembled Shargh, and that according to its license it was not allowed to specifically contain political materials. Such an allegation directly contravenes the official press law of the Islamic Republic of Iran which states, "Any journal of non-political license is allowed to specify up to 20 percent of its space to political issues and its crossover with other journalistic fields."

However, many believe that current issue is just an excuse to remove the reformist press from the news arena.

"This is not the true reason for Roozegar's confiscation. At present there are other dailies that are not licensed for political analysis and yet continue to be somewhat purely political; newspapers such as Hamshahri and Jaam-e Jam [two of the state-run dailies]," said the spokesman of Iran's Press Rights Defenders, Mashaollah Shamsolvaezin. "The fact is that they do not want independent reformist papers such as Roozegar which had hired Shargh's staff to exist."

Shargh was an intensively-read newspaper among the Iranian elite and students. It was considered the very last of the pro-Khatami journals that had still managed to maintain its presence during the first year of Ahmadinejad's presidency. The paper's closure, which coincided with the shutting down of three other independent magazines — Nameh, Hafiz, and Khatereh — provoked a wave of condemnation by moderate politicians, as well as the elite and regular readers.

Some of the charges that led to Shragh's closure were as follows:

  • Publishing a report mentioning pre-marriage sexual relations.
  • Reflecting "interfering opinions" of a foreign ambassador in Tehran within an interview accompanied by an "affirmative" picture of his.
  • Naming the BBC as an authentic news source and interviewing one of its journalists.
  • Circulating Marxist beliefs.
  • Sarcasm directed at the Islamic revolution.
  • Publication of an ambiguous caricature. (The caricature showed a chess table with a donkey, instead of horse, that had a circle of light above its head. Allegations indicated that it resembled Mahmoud Ahmadinjad when he had said he was covered in a glow at the United Nation's General Assembly.)

Although Iranian journalists had always faced a certain amount of censorship in their work, the new accusations revealed a new level of intolerance toward the press. In another case Iran Daily, a government-run newspaper, was closed down after the publication of a caricature that was considered insulting to the Turkish minority in Iran. Its caricaturist, Mana Neyestani, and the editor, Mehrdad Ghasemfar, were detained for months and after substituting the some 300 pro-reform staff of the newspaper, Iran Daily began its publication with a new format and policy.

The Nameh monthly was also shut down for publication of a poem which was accused of being insulting to the leader of the Islamic Revolution, Ayatollah Khomeini. The renowned poet, 70-year old Simin Behbahani, was previously beaten up by the police while attending a protest against women's rights violations in Iran.

Previously, many news topics were semi-officially frowned upon (and according to internal announcements, prohibited) for journalists to explore; areas such as "any analysis on Iran's nuclear program." But now with the new accusations many Iranian journalists wonder where their new redlines are, and fear of probable prosecution has led into an atmosphere of self-censorship which has profoundly paralyzed journalistic activities.

The anti-media policy has contagiously moved from the print media to the news-providers as well. Right after his ascension, President Ahmadinejad's culture minister Hossein Saffar Harandi ordered the formation of a new Board of News Wires Observers to keep an eye on the activities of the major news-providers. Following the formation of the board, ISNA news agency was charged with many accusations and reportedly 40 to 50 percent of ILNA's reformist reporters were expelled due to "financial reasons," as announced.

The Association for Freedom of the Press in Iran says that current conditions mark the darkest period in a century for the profession. In a statement, the Association voiced widespread concerns about increased pressure and restrictions being put on journalists and the independent media. The statement demanded that those who openly break the law be brought to justice, and added that, in recent months, the Association had received disturbing reports about violations of the constitution and press laws by the Ministry of Culture and Islamic Guidance, the Supreme National Security Council, and prosecutors in Tehran and the provinces.

Satellite

For a country that according to the law all broadcasts are state-run, and the guidelines for the programs are directly determined by the representative of Supreme leader, satellite T.V. channels presented an attractive alternative that soon drew the attention of millions of Iranians in the early 1990s.

In 1995 the Iranian Parliament passed a law outlawing satellite dishes in a bid to rid the country of "western influences" and prevent foreign-based opposition groups from broadcasting into the country. However, the ban was not strictly enforced.

During mid-summer, Iranian police launched a crackdown against "decadent" satellite television in the Islamic Republic, raiding rooftops in Tehran and other major cities to seize thousands of illegal dishes.

The action followed a warning issued recently by Tehran's then-metropolitan police chief under Khatami, up until his successor took the office last year, to the country's estimated three to four million satellite television watchers who dared to defy the law.

"The use of satellite dishes is prohibited by law and we ask people not to use this equipment anymore," Morteze Talaie said.

Police armed with warrants raided rooftops of large apartment blocks and high-rises in the chic northern and western areas of Tehran on Sunday and have conducted similar operations in other cities, witnesses and press reports said. The police reportedly did not enter apartments themselves, instead seizing dishes installed on roofs of large buildings.

The head of Tehran's provincial police, Reza Zarei, was quoted in the press as saying that the police force will act "against people who conspicuously install their dishes."

Programs broadcast on satellite channels are considered "decadent" by the authorities in the Islamic Republic, which frequently tries to jam the airwaves. Hacked decoders make it possible to receive several hundred satellite channels, including more than two dozen financed by the exiled Iranian opposition, mainly based in the United States.

Many Iranians also use the satellite channels to listen to foreign-based Persian news broadcasts such as the BBC, VOA, and Radio Farda, an American-funded station that covers the human rights violations and political issues intensively.

Books

According to many Iranian writers and publishers, during the past year the publication of many previously authorized books has been held up. There are also reports that many of the books that had obtained a publication license were not granted a distribution permission and therefore have not reached the book shelves.

The culture minister of Ahmadinejad's cabinet, Hossein Saffar Harandi, and the secretary of interior affairs, Mostafa poor Mohammadi, have repeatedly stated their opposition to the cultural programs of Khatami's government calling them anti-Islamic.

"None of the cultural products [books, films, music, etc.] that you see right now are not driven from or approved by this new government," said Saffar Harandi. "The cultural products which are not based on the Koran's studies are not acceptable and we do not need them. Our cultural programs are yet to get started."

During the last Annual Book Fair in Tehran, many of the previously licensed books were seized from the shelves.

Many of Ahmadinejad's key ministers such as Interior Minister Mostafa Poor Mohammadi, Intelligence Minister Gholam Hossein Mohseni Ezhei, and Minister of Culture Hossein Saffar Harandi, are strongly accused by human rights watchdogs for their alleged role in the clampdown on dissidents in past years. Some are even charged with performing key roles in the mass execution of political prisoners during 1988, and the intellectuals chain murders of 1998.

Poor Mohammadi, then deputy intelligence minister, was expelled from duty after Khatami's victory in the election for the role he played in the aforementioned murders.

According to the Paris-based media watchdog Reporters Without Borders, Iran is the biggest jail for journalists in the Middle East. It ranks among the top ten press rights violator states of the world, and its leaders, Ayatollah Ali Khamenei and president Mahmoud Ahmadinejad, are among the enemies of the free flow of information.

The government denies these charges, saying it welcomes criticism.

THAILAND: DTAC may partner with Thai Mobile on 3G

Mobile operator DTAC announce its willingness to partner with Thai Mobile after National Telecommunications Commission fails to clarify its 3G specifications

Bangkok Post
Thursday, July 26, 2007

By Srisamorn Phoosuphanusorn

The mobile operator DTAC says it is open to a partnership deal for third-generation (3G) mobile service with Thai Mobile if the state cellular operator proposes a viable business venture.

But the country's second-largest cellular firm still intends to build its own 3G network to take full business control, said Sigve Brekke, DTAC's chief executive.

Mr Brekke said DTAC had developed an alternative low-risk, high-return approach toward 3G investment since the 3G licensing framework drafted by the National Telecommunications Commission (NTC) is still unclear.

The decision came after the NTC failed to offer a clear picture on 3G specifications, particularly concerning the 3G licence fee, universal service obligation (USO) fee and the number of cell sites that are allowed.

"We are awaiting proposals from TOT Plc for a possible venture with Thai Mobile. But a partnership agreement would largely depend on how such a commercial proposal is presented," said Mr Brekke.

Thai Mobile is a joint venture between TOT (58%) and CAT Telecom (42%). It has around 68,000 subscribers. Thai Mobile is the only operator using the 1900 megahertz spectrum, the global 3G cellular-technology platform.

"We are now open to taking part with Thai Mobile, depending on the degree of complexity such as the form of revenue sharing and the number of cell sites to be constructed," Mr Brekke said.

"DTAC would only take charge of marketing while Thai Mobile would take responsibility for billing and services."

As an alternative, he said, DTAC had also asked TOT to let all Thai Mobile customers use its roaming network in exchange for 4-5 million new numbers. DTAC would pay TOT two baht per number per month, similar to the arrangement with the NTC.

The proposal came in response to the NTC's complex procedures for allocating new numbers. TOT still needs permission from the NTC for the number allocation to be approved.


However, Mr Brekke said the best type of 3G investment for DTAC would depend on the NTC's licensing framework and specifications.

He disagreed with the national telecom regulator's planned auction of 3G licences to maximise returns to the state, saying it would create overly high costs for operators that would inevitably be passed on to consumers.

He urged the NTC to use the "beauty contest" method focusing on technical and marketing strengths, forcing operators to commit to creative ways to differentiate services and build strong network coverage.

He cited key lessons from the past failure of some operators in Hong Kong, Singapore, the UK, Germany and France. The auction method used in these markets brought in massive sums for governments but created huge costs that customers ultimately had to pay through high service fees.

Mr Brekke said DTAC would not rush to invest in 3G in the belief that it would start commercial operations in 2009.

But he said DTAC would be able to upgrade existing 2G base stations to 3G faster and offer lower up-front investment costs than rivals thanks to the company's 3G-enabled cell sites.

Before expanding the 3G business, he said, the NTC should resolve current regulatory problems, including access and interconnection charges, concession amendments, competition rules and number portability.

DTAC shares closed yesterday on the SET at 46.25 baht, up 50 satang, in trade worth 126.48 million baht.

DoubleHorn Communications Appoints Extensive VoIP Expertise to Senior Management Team

Three Seasoned VoIP Engineering Experts Join DoubleHorn to Support Triple-Digit Growth Across Customer Base

AUSTIN, Texas--(BUSINESS WIRE)--DoubleHorn Communications, the premier Voice Over IP (VoIP) Managed Communications provider for small businesses in Texas, announced today the addition of three seasoned VoIP Engineers to support their rapidly expanding customer base and provide technical direction for their hosted business-class VoIP solution. Ken Ryon, Vince Deli, and David Byrd provide a combined 44 years of telecommunications experience, which includes architecting regional and national deployments of hosted business-class VoIP systems.

"With DoubleHorn growing in leaps and bounds, it makes sense to add some of the best VoIP engineering minds in the industry to our growing ranks," said Tab Schadt, CEO of DoubleHorn Communications. "Ken, Vince, and David have decades of experience each in telecommunications and bringing VoIP to small businesses and will add invaluable contributions to our platform and our ability to continue to provide quality of service to our expanding customer base."

The three telecommunications professionals bring a wealth of networking, operations, product development, and customer service experience to DoubleHorn, which is experiencing triple-digit growth as the demand for VoIP services grows among small businesses:

  • Ken Ryon, Vice President of Engineering and Network Operations, leads engineering and network operations, develops product requirements, and oversees the ongoing development of DoubleHorn Communications service delivery architecture and core service applications. Ken has 18 years of telecommunications experience, most recently at Voxpath Networks.
  • Vince Deli, Principal System Engineer, is responsible for analyzing, designing, evaluating and recommending hardware, software and network systems configurations. Vince has been working in telecommunications for 14 years in the Austin area. He joins Ken from Voxpath Networks.
  • David Byrd, Manager of Network Engineering & Service Operations, is responsible for the ongoing development and support of the service delivery network infrastructure and oversees the team of customer care professionals. David has 12 years experience deploying telecommunications systems in the field for area companies including GenBand and Nortel Networks.

About DoubleHorn: Austin, Texas based DoubleHorn Communications specializes in business-class VoIP, high-speed Internet access, data backup and recovery, voicemail and unified messaging features. DoubleHorns IP-ONE Small Business Communication Solution is a fully interoperable and turn-key managed service offering that includes dedicated T1 internet access, Polycom IP-phones, and a fully-managed ADTRAN router at no charge.

TOT to footnote access fees

July 27,2007

KOMSAN TORTERMVASANA

TOT Plc says it will split access charge earnings from its financial statement to more accurately reflect the company's financial position and will begin negotiating with private operators on interconnection charges.

Djit Laowattana, a member of the TOT board, said access charge earnings would appear as a note to the state enterprise's financial report. They would not be included in its revenue numbers because service providers have refused to pay the charges.

The mobile operators DTAC and True Move have withheld access payments since last November, arguing that TOT should adopt the interconnection-fee system approved by the National Telecommunications Commission. TOT has been reluctant to comply since it earns 14 billion baht a year from access charges and believes it would earn less under the new system

The proposal would be submitted to the TOT board for approval today, Mr Djit said. If approved, access charges would appear as a remark in its monthly financial statement next month, he said.

He said that earnings from access charges were uncertain because all concession agreements made with private operators, DTAC and True Move, would soon expire.

He said that TOT had started to negotiate interconnection charges with private operators. He said DTAC had assured TOT that it would accept a flat-rate system, he said.

At present TOT earns 200 baht per number per month on postpaid service and 18% on prepaid services from DTAC and True Move.

VoIP Carrier ElephantTalk Using Blueslice HLR for New Mobile Offering

July 25, 2007

By Patrick Barnard
TMCnet Assignment Editor

VoIP carrier ElephantTalk, a subsidiary of publicly-owned Elephant Talk Communication, Inc., has reportedly selected the Blueslice HLR with enhanced features to help it deliver a new GSM/WiMAX (News - Alert)/WiFi operation to its customers. ElephantTalk’s expansion into the mobile market will enhance the company’s existing fixed and VoIP offerings.

Founded in 1994, ElephantTalk is a facility-based international long distance carrier with hubs in Hong Kong, Los Angeles, Boston, New York, Singapore and Beijing. As a licensed ISR carrier with its US based facilities, carrier interconnection, special termination arrangements and existing circuits between US and Hong Kong, the company aims to provide the best price and first-mover advantages for Hong Kong-based carriers.

ElephantTalk’s general strategy is to leverage its expertise and established relationships with carriers in the Asian-Pacific region to pursue early entry into selected deregulating markets. To accomplish this, it has signed service agreements and is currently implementing interconnections with top North American carriers likeAT&T ( News - Alert), WorldCom and Teleglobe for terminating their minutes in the Asia-Pacific region. A carrier of carriers, ElephantTalk provides international long distance to over 220 foreign countries through a flexible network comprised of resale arrangements with long distance providers, leased transmission facilities, various foreign termination relationships and international gateway switches.

Headquartered in Montreal, Canada, privately-held Blueslice Networks provides multi-profile subscriber management solutions for the Mobile, VoIP, FMC and M2M markets. The company’s solutions allow mobile service providers to delivering innovative and differentiated services and reduce operational costs, while at the same time controlling their principal asset, their subscriber base. Its Blueslice Converged Subscriber Platform 3000T is designed for GSM/GPRS/UMTS networks. A tightly integrated solution, it lets end-users access converged communication services seamlessly over any type of access with a single subscription and set of preferences. The company claims this carrier-grade open standard platform is the only converged HLR/AuC, HSS,SIP Registrar and SIP Redirect Server, which together enable universal mobility across all access networks.

With this platform, Blueslice can deliver next generation solutions to the world's leading mobile service providers, including wireless carriers, MVNOs, VoIP providers and alternate carriers. Its Home Location Register is a central database that contains details of each mobile phone subscriber that is authorized to use the core network. The next generation HLR also boasts features such as Advanced Low Cost Roaming, HLR/HSS-based Fixed MobileConvergence ( News - Alert) (FMC) and hosting functions. In particular, the Multi-IMSI capability will allow ElephantTalk to economically deploy a competitive global service.

ElephantTalk’s new mobile offering will also deliver WiFi (News - Alert) and WiMAX. This will allow enterprises, ISPs, and resellers to deliver converged mobile services - including full triple-play with content distribution from entertainment companies and advanced multimedia devices.

"ElephantTalk is already known as a provider of telecommunications services: we already have the interconnection agreements in place, the infrastructure backend installed, a distribution network, and the brand recognition. It only makes sense for us to expand into the mobile market and to do it as a globalGSM and FMC player with control over our network," said Martin Zuurbier, COO and CTO of ElephantTalk, in a press release. "The Blueslice subscriber platform is the best solution that meets our requirements."

----------

Patrick Barnard is Associate Editor for Customer Interaction Solutions magazine and Assignment Editor for TMCnet. To see more of his articles, please visit Patrick Barnard’s columnist page.

Tellabs reports second-quarter revenue of $535 million

Company Snapshot: TLAB Print This Story Email This Story Save this Link
View PR Newswire's RSS Feed Blogs Discussing this News Release Search Blogs that Mention this News Release Click this link to view linked Bookmarking Services Click this link to view linked Blogging Services


Tellabs Reports Second-Quarter Revenue of $535 Million

    NAPERVILLE, Ill., July 24 /PRNewswire-FirstCall/ -- Tellabs today
reported second-quarter 2007 revenue of $535 million, down 3% from $549
million in the second quarter of 2006.
Tellabs earned $30 million or 7 cents per share in the second quarter
of 2007 on a GAAP basis, down 45% from $54 million or 12 cents per share in
the second quarter of 2006. On a non-GAAP basis, Tellabs earned $38 million
or 9 cents per share, down 48% from $73 million or 16 cents per share in
the second quarter of 2006. Non-GAAP results for second-quarter 2007
exclude pretax charges of $14 million for special items, including $8
million or 1.2 cents per share in equity-based compensation expense.
"As the telecom industry transforms, Tellabs' new technologies are
taking root in our customers' networks," said Krish A. Prabhu, Tellabs
president and chief executive officer. "We continue to focus on improving
gross profit margins related to those products and technologies."
Broadband -- Second-quarter 2007 revenue from the broadband segment
totaled $246 million, down 17% from $298 million in the second quarter of
2006. Within the broadband segment, second-quarter access revenue was $135
million, down 29% from $190 million in the second quarter of 2006.
Second-quarter managed access revenue was $77 million, down 11% from $86
million in the second quarter of 2006. Second-quarter data revenue was a
record $35 million, up 56% from $22 million in the year-ago quarter.
Transport -- Second-quarter 2007 transport revenue totaled $223
million, including deferred revenue from two prior quarters, up 10% from
$202 million in the second quarter of 2006.
Services -- Second-quarter 2007 services revenue was $66 million,
including deferred revenue from two prior quarters, up 34% from $49 million
in the second quarter of 2006.
Third-Quarter 2007 Guidance -- The following statements are
forward-looking statements that are based on current expectations and
involve risks and uncertainties, some of which are set forth below. Tellabs
expects third-quarter revenue to be about $500 million, plus or minus.
Tellabs expects non-GAAP gross margin to be about 36%, plus or minus,
depending on product mix; non-GAAP gross margin excludes about $1.5 million
in equity-based compensation expense. Tellabs expects non-GAAP operating
expense to be flat to slightly down compared with the second quarter of
2007; non-GAAP operating expense excludes about $6.5 million in
equity-based compensation expense.
Share Repurchase -- Under a previously announced share repurchase
program, Tellabs repurchased 0.9 million shares at a cost of $10 million
during the second quarter of 2007. Since 2005, Tellabs has repurchased 49.7
million shares at a cost of $500 million (about 11% of shares outstanding).
Simultaneous Webcast and Teleconference Replay -- Tellabs will host an
investor teleconference at 7:30 a.m. Central Daylight Time today to discuss
its second-quarter 2007 results and provide its outlook for the third
quarter of 2007. Internet users can hear a simultaneous webcast of the
teleconference at http://www.tellabs.com; click on the webcast icon. A
taped replay of the call will be available beginning at approximately 10:30
a.m. Central Daylight Time today, until 10:30 p.m. Central Daylight Time on
Thursday, July 26, at 800-642-1687. (Outside the United States, call
706-645-9291.) When prompted, enter the Tellabs conference ID number:
5440421. A podcast of the call will be available at
http://www.tellabs.com/news/feeds/ later today.
Tellabs advances telecommunications networks to meet the evolving needs
of users. Solutions from Tellabs enable service providers to deliver
high-quality voice, video and data services over wireline and wireless
networks around the world. Ranked among the BusinessWeek InfoTech 100,
Tellabs (Nasdaq: TLAB) is part of the NASDAQ-100 Index, NASDAQ Global
Select Market, Ocean Tomo 300(TM) Patent Index and the S&P 500.
http://www.tellabs.com
Forward-Looking Statements -- This news release contains
forward-looking statements, including but not limited to the guidance
information contained in this release that involve risks and uncertainties.
Actual results may differ from the results discussed in the forward-looking
statements. Factors that might cause such a difference include, but are not
limited to, risks associated with: the competitive landscape, including
pricing and margin pressures, the response of customers and competitors,
industry consolidation, the introduction of new products, the entrance into
new markets, the ability to secure necessary resources, and the economic
changes generally impacting the telecommunications industry. The company
undertakes no obligation to revise or update these forward-looking
statements to reflect events or circumstances after today or to reflect the
occurrence of unanticipated events. For a more detailed description of the
risk factors, please refer to the company's SEC filings.
Tellabs(R) and Tellabs logo are trademarks or its affiliates in the
United States and/or other countries. Any other company or product names
mentioned herein may be trademarks of their respective companies.
TELLABS, INC.
CONSOLIDATED STATEMENTS OF INCOME
(Unaudited)


Second Quarter Six Months
In millions, except per-share data 6/29/07 6/30/06 6/29/07 6/30/06
Revenue
Products $469.0 $500.6 $879.0 $974.7
Services 65.5 48.7 107.4 89.3
534.5 549.3 986.4 1,064.0
Cost of Revenue
Products 307.1 264.5 540.1 506.7
Services 39.8 30.6 72.8 60.8
346.9 295.1 612.9 567.5

Gross Profit 187.6 254.2 373.5 496.5

Gross profit as a percentage of revenue 35.1% 46.3% 37.9% 46.7%

Gross profit as a percentage of
revenue - products 34.5% 47.2% 38.6% 48.0%
Gross profit as a percentage of
revenue - services 39.2% 37.2% 32.2% 31.9%

Operating Expenses
Research and development 85.3 91.7 169.8 184.6
Sales and marketing 44.4 45.0 90.2 90.0
General and administrative 24.7 28.5 51.3 56.6
Intangible asset amortization 5.7 7.1 11.3 14.1
Restructuring and other charges -- 2.0 -- 2.0
160.1 174.3 322.6 347.3

Operating Earnings 27.5 79.9 50.9 149.2

Other Income
Interest income, net 13.4 11.4 25.2 21.9
Other income (expense), net 0.3 (7.4) 0.6 (6.0)
13.7 4.0 25.8 15.9

Earnings Before Income Tax 41.2 83.9 76.7 165.1
Income tax expense (11.6) (30.4) (21.6) (59.2)
Net Earnings $29.6 $53.5 $55.1 $105.9


Net Earnings Per Share
Basic $0.07 $0.12 $0.13 $0.24
Diluted $0.07 $0.12 $0.12 $0.23

Weighted Average Shares Outstanding
Basic 438.1 447.7 438.1 448.8
Diluted 443.3 458.5 443.2 459.6


TELLABS, INC.
CONSOLIDATED BALANCE SHEETS

6/29/07 12/29/06
In millions, except share data Unaudited
Assets
Current Assets
Cash and cash equivalents $262.7 $153.6
Investments in marketable securities 1,056.3 1,146.5
1,319.0 1,300.1

Other marketable securities 294.1 288.6
Accounts receivable, net of allowances of
$3.8 and $3.8 386.7 411.0
Inventories
Raw materials 38.7 34.5
Work in process 17.5 19.7
Finished goods (includes costs of $12.6
and $28.6 related to deferred revenue) 118.9 112.8
175.1 167.0
Income taxes 19.2 10.7
Miscellaneous receivables and other current
assets 52.9 55.2
Total Current Assets 2,247.0 2,232.6

Property, Plant and Equipment
Land 20.9 20.8
Buildings and improvements 205.3 205.5
Equipment 430.3 411.2
656.5 637.5
Accumulated depreciation (356.9) (329.6)
299.6 307.9
Goodwill 1,108.6 1,107.4
Intangible Assets, net of amortization 78.3 89.6
Other Assets 168.2 184.9
Total Assets $3,901.7 $3,922.4

Liabilities and Stockholders' Equity
Current Liabilities
Accounts payable $87.5 $119.5
Accrued compensation 55.0 70.7
Restructuring and other charges 7.5 7.8
Income taxes 79.7 97.9
Stock loan 294.1 288.6
Deferred revenue 45.9 55.4
Other accrued liabilities 113.4 122.3
Total Current Liabilities 683.1 762.2

Long-Term Restructuring Liabilities 18.6 22.3
Income Taxes 115.7 128.2
Other Long-Term Liabilities 80.8 71.4

Stockholders' Equity
Preferred stock: authorized 5,000,000 shares
of $0.01 par value; no shares issued and
outstanding -- --
Common stock: authorized 1,000,000,000 shares
of $0.01 par value; 491,577,911 and
489,034,812 shares issued 4.9 4.9
Additional paid-in capital 1,430.1 1,395.3
Treasury stock, at cost: 53,284,655 and
49,919,908 shares (634.5) (598.7)
Retained earnings 2,103.4 2,042.0
Accumulated other comprehensive income 99.6 94.8
Total Stockholders' Equity 3,003.5 2,938.3
Total Liabilities and Stockholders' Equity $3,901.7 $3,922.4


TELLABS, INC.
CONSOLIDATED STATEMENTS OF CASH FLOW
(Unaudited)

Six Months
6/29/07 6/30/06
In millions
Operating Activities
Net earnings $55.1 $105.9
Adjustments to reconcile net earnings to net
cash provided by operating activities:
Depreciation and amortization 46.6 51.6
Stock-based compensation 17.1 33.8
Deferred income taxes 7.6 22.5
Excess tax benefits from stock-based
compensation (2.1) (15.2)
Restructuring and other charges -- 2.0
Net changes in assets and liabilities:
Accounts receivable 27.6 (58.8)
Inventories (5.9) (33.5)
Miscellaneous receivables and other current
assets (3.8) 13.9
Other assets 3.0 18.7
Accounts payable (34.0) 7.2
Restructuring and other charges (4.0) (4.8)
Deferred revenue (9.5) 22.7
Other accrued liabilities (25.7) (41.0)
Income taxes (15.1) (8.7)
Other long-term liabilities 2.9 0.6
Net Cash Provided by Operating Activities 59.8 116.9

Investing Activities
Capital expenditures (25.7) (34.4)
Disposals of property, plant and equipment 1.3 0.5
Payments for purchases of investments (594.4) (961.7)
Proceeds from sales and maturities of investments 685.7 345.2
Net Cash Provided by (Used for) Investing Activities 66.9 (650.4)

Financing Activities
Proceeds from issuance of common stock under stock
plans 14.7 81.1
Repurchase of common stock (35.8) (156.8)
Excess tax benefits from stock-based compensation 2.1 15.2
Net Cash Used for Financing Activities (19.0) (60.5)

Effect of Exchange Rate Changes on Cash 1.4 8.4
Net Increase (Decrease) in Cash and Cash Equivalents 109.1 (585.6)
Cash and Cash Equivalents - Beginning of Year 153.6 880.8
Cash and Cash Equivalents - End of Period $262.7 $295.2
Forward-Looking Statements
This presentation contains forward-looking statements made pursuant to
the safe harbor provisions of Section 27A of the Securities Act of 1933, as
amended, and Section 21E of the Securities Exchange Act of 1934, as
amended. These statements reflect management's expectations, estimates and
assumptions, based on the information available at the time the document
was prepared. These forward-looking statements include, but are not limited
to, statements regarding future events, plans, goals, objectives and
expectations. The words "anticipate," "believe," "foreseeable," "estimate,"
"target," "expect," "predict," "plan," "project," "intend," "likely,"
"possible," "will," "would," "should," "could," "may," "continue" and
similar expressions are intended to identify forward-looking statements.
RESULTS OF OPERATIONS
For the second quarter of 2007, our revenue was $534.5 million, down
2.7% from $549.3 million in the second quarter of 2006. Year-to-date,
revenue was $986.4 million, down 7.3% from $1,064.0 million in 2006.
Consolidated gross margin decreased by 11.2 percentage points to 35.1% in
the second quarter compared with 46.3% in the second quarter of 2006. On a
six-month basis, consolidated gross margin was down 8.8 percentage points
to 37.9% from 46.7% in 2006. Operating expenses were $160.1 million in the
second quarter of 2007, compared with $174.3 million in the second quarter
of 2006. For the first half of 2007, operating expenses were $322.6
million, down from $347.3 million in 2006. Net earnings for the second
quarter of 2007 were $29.6 million or $0.07 per share (basic and diluted)
compared with $53.5 million or $0.12 per share (basic and diluted) in the
same period of 2006. Net earnings for the six-month period in 2007 were
$55.1 million or $0.13 per basic share and $0.12 per diluted share compared
with $105.9 million or $0.24 per basic share and $0.23 per diluted share
for the first six months in 2006.
Revenue (in millions)

Second Quarter Six Months
2007 2006 Change 2007 2006 Change
Products $469.0 $500.6 (6.3%) $879.0 $974.7 (9.8%)
Services 65.5 48.7 34.5% 107.4 89.3 20.3%
Total revenue $534.5 $549.3 (2.7%) $986.4 $1,064.0 (7.3%)
In 2007, product revenue declined 6.3% in the second quarter and 9.8%
on a six-month basis compared with 2006. The decrease was primarily due to
reduced product revenue from a major customer and from copper-based access
platforms, which was partially offset by revenue from the rollout of our
Tellabs(R) 7100 OTS with ROADM product in our Transport segment.
In 2007, services revenue increased by 34.5% in the second quarter and
by 20.3% on a six-month basis compared with the same periods in 2006. The
increase was primarily due to higher revenue from deployment services and
product-support services.
On a geographic basis, revenue from customers in North America was
$413.2 million in the second quarter of 2007, down 2.8% from a year ago.
Revenue from customers outside North America was $121.3 million in the
second quarter of 2007, down 2.4% from a year ago. On a six-month basis,
North America revenue was $754.6 million, down 9.8% from a year ago.
Revenue from customers outside North America was $231.8 million, down 2.0%
from a year ago.
Gross Margin

Second Quarter Six Months
% Point % Point
2007 2006 Change 2007 2006 Change
Products 34.5% 47.2% (12.7%) 38.6% 48.0% (9.4%)
Services 39.2% 37.2% 2.0% 32.2% 31.9% 20.3%
Consolidated 35.1% 46.3% (11.2%) 37.9% 46.7% (8.8%)
In 2007, our products margin decreased in the second quarter and for
the first six months compared with the same periods in 2006. The decrease
was due to a product mix shift toward products such as our Tellabs(R) 7100
OTS with ROADM and ONT products, as well as lower prices on our ONTs.
Our services margin increased in the second quarter and first six
months of 2007 compared with 2006, due to an increase in higher margin
support services revenue.
Operating Expenses (in millions)

Second Quarter Percent of Revenue
2007 2006 Change 2007 2006
Research and development $85.3 $91.7 ($6.4) 16.0% 16.7%
Sales and marketing 44.4 45.0 (0.6) 8.3% 8.2%
General and administrative 24.7 28.5 (3.8) 4.6% 5.2%

Subtotal 154.4 165.2 (10.8) 28.9% 30.1%

Intangible asset amortization 5.7 7.1 (1.4)
Restructuring and other charges -- 2.0 (2.0)
Total Operating Expenses $160.1 $174.3 ($14.2)


Six Months Percent of Revenue
2007 2006 Change 2007 2006
Research and development $169.8 $184.6 ($14.8) 17.2% 17.3%
Sales and marketing 90.2 90.0 0.2 9.1% 8.5%
General and administrative 51.3 56.6 (5.3) 5.2% 5.3%

Subtotal 311.3 331.2 (19.9) 31.6% 31.1%

Intangible asset amortization 11.3 14.1 (2.8)
Restructuring and other charges -- 2.0 (2.0)
Total Operating Expenses $322.6 $347.3 ($24.7)
Operating expenses decreased by $14.2 million to $160.1 million in the
second quarter of 2007, compared with $174.3 million in the second quarter
of 2006. For the first six months of 2007, operating expenses decreased by
$24.7 million to $322.6 million compared with the same period in 2006. The
reduction in our operating expenses for the quarter and six months is
primarily due to actively controlling expenses and reduced accruals for
incentive compensation plans.
Other Income (in millions)
Second Quarter Six Months
2007 2006 Change 2007 2006 Change
Interest income, net $13.4 $11.4 $2.0 $25.2 $21.9 $3.3
Other income (expense),
net 0.3 (7.4) 7.7 0.6 (6.0) 6.6
Total $13.7 $4.0 $9.7 $25.8 $15.9 $9.9
Interest income, net, was higher in the second quarter and the first
six months of 2007, compared with 2006 due to larger invested balances.
Other income (expense), net, improved in the second quarter and for the
first six months of 2007 compared with the same periods in 2006 due to more
favorable results from foreign exchange and investments. In the second
quarter of 2006, we incurred a loss of $3.3 million for foreign exchange
activities and a loss of $4.6 million for an other-than-temporary
impairment to long-term investments.
Income Taxes
Our effective tax rate was 28.1% for the second quarter of 2007 and for
the first half of 2007, compared with a rate of 36.3% in the second quarter
of 2006 and 35.9% for the first six months of 2006. The rate change was
primarily attributable to the inclusion of a benefit for U.S. research and
development credits in the current year, and a benefit related to earning a
greater percentage of our overall pretax income from foreign jurisdictions
that are taxed at lower rates.
We adopted the provisions of FIN 48, Accounting for Uncertainty in
Income Taxes, on December 30, 2006. The liability for unrecognized tax
benefits as of December 30, 2006, as determined under FIN 48, was $76.5
million. Although we cannot estimate with reasonable reliability the
periods of cash settlement, we expect that resolution of tax issues related
to $12 million to $14 million of unrecognized tax benefits could be reached
in the next 12 months; resolution of tax issues with respect to
approximately $48 million could be reached in the next 18 to 24 months. We
are not able to estimate with reasonable reliability the period of cash
settlement with respect to the remaining balance of $14.5 million to $16.5
million of unrecognized tax benefits, as such settlement will depend on
examination of returns by various jurisdictions, the precise amounts and
timing of which are uncertain.
Segments

Revenue (in millions)

Second Quarter Six Months
2007 2006 Change 2007 2006 Change
Broadband $246.4 $298.4 (17.4%) $465.1 $558.1 (16.7%)
Transport 222.6 202.2 10.1% 413.9 416.6 (0.6%)
Services 65.5 48.7 34.5% 107.4 89.3 20.3%
Total
revenue $534.5 $549.3 (2.7%) $986.4 $1,064.0 (7.3%)


Segment Profit (Loss)* (in millions)

Second Quarter Six Months
2007 2006 Change 2007 2006 Change
Broadband ($0.8) $38.1 (102.1%) ($15.6) $59.5 (126.2%)
Transport 81.0 112.1 (27.7%) 191.9 234.9 (18.3%)
Services 26.4 19.3 36.8% 36.3 30.6 18.6%
Total segment
profit $106.6 $169.5 (37.1%) $212.6 $325.0 (34.6%)
*We define segment profit (loss) as gross profit less research and
development expenses. Segment profit (loss) excludes sales and marketing
expenses, general and administrative expenses, the amortization of
purchased deferred stock compensation and intangibles, and the impact of
equity-based compensation (which includes restricted stock and performance
stock units granted after June 30, 2006, and stock options).
Broadband
Revenue
Revenue from our Broadband segment was $246.4 million in the second
quarter of 2007, down $52.0 million from the prior-year quarter. For the
first six months, revenue from our Broadband segment was $465.1 million,
down $93.0 million from the first six months of 2006. While our access and
managed access revenue decreased for both time-period comparisons, our data
product revenue increased.
Second quarter access revenue decreased to $134.6 million in 2007 from
$189.8 million in 2006. On a six-month basis, access revenue decreased to
$255.8 million in 2007 from $353.9 million in 2006. Revenue was lower in
both time periods due to lower revenue from independent operating companies
for copper-based platforms, lower prices on single-family ONTs and lower
revenue from Fiber-to-the-Curb platforms. Revenue from ONTs was lower due
to price reductions despite increased unit volume. Approximately 68% of
access revenue came from fiber-based platforms, with the balance coming
from copper-based platforms.
Managed access revenue declined to $77.1 million in the second quarter
of 2007 from $86.3 million in the same quarter of 2006. For the first six
months of 2007, managed access revenue declined to $145.8 million from
$160.0 million in the first six months of 2006. An increase in revenue from
the Tellabs 8100 system was offset by reduced SDH-transport and cable
telephony product revenue.
Data product revenue was $34.7 million in the second quarter of 2007,
up 55.6% from the year-ago quarter. Data product revenue was $63.5 million
for the first six months of 2007, up 43.7% compared with the first six
months of 2006. Revenue from existing customers and new customers drove our
data products revenue growth.
Segment Profit (Loss)
Our Broadband segment produced a loss of $0.8 million in the second
quarter of 2007 compared with a profit of $38.1 million in the second
quarter of 2006. The decrease in the quarter resulted from lower revenue,
lower prices on our single-family ONTs and a shift in our product mix
toward lower-margin products. For the first six months of 2007, our
Broadband segment produced a loss of $15.6 million, down $75.1 million from
a profit of $59.5 million in the comparable period of 2006. The decrease
for the first six months was primarily due to higher volumes on our
single-family ONTs and lower overall revenue.
Transport
Revenue
Revenue from our Transport segment was $222.6 million in the second
quarter of 2007, up $20.4 million from the second quarter of 2006. The
increase in revenue was due to a rollout of our Tellabs(R) 7100 OTS with
ROADM product to a major customer, which was partially offset by a decline
in revenue from another major customer. On a six-month basis, transport
revenue was $413.9 million, down by $2.7 million from the same period in
2006. The decrease was due to a decline in revenue from a major customer,
which was offset by revenue from a rollout of our Tellabs(R) 7100 OTS with
ROADM product.
During the second quarter of 2007, approximately 36% of the Tellabs(R)
5500 wideband cross-connect product revenue came from new systems, system
expansions and system upgrades. The balance of these percentages consisted
of port-card growth on the installed base. We shipped approximately 1.9
million T-1 equivalents during the second quarter of 2007 and approximately
4.3 million in the first six months of 2007, continuing to build our
position in the North American transport market.
Segment Profit
Our Transport segment profit was $81.0 million in the second quarter of
2007, down $31.1 million from the second quarter of 2006. Our segment
profit for the first six months was $191.9 million, down from $234.9
million for the first six months of 2006. The decreases for the quarter and
the first six months were due to a shift in the mix of transport revenue,
which includes greater revenue from our Tellabs(R) 7100 OTS with ROADM
product at essentially a breakeven level and lower revenue from our
Tellabs(R) 5500 wideband cross- connect.
Services
Revenue
Revenue from our Services segment grew by $16.8 million to $65.5
million for the second quarter of 2007, compared with $48.7 million in the
second quarter of 2006. On a six-month basis, revenue from our Services
segment was $107.4 million in 2007, up $18.1 million from the first six
months of 2006. During both time periods, our revenue increased primarily
from deployment services and product-support services.
Segment Profit
Our Services segment profit was $26.4 million for the second quarter of
2007, up $7.1 million from the second quarter of 2006. For the first six
months, Services segment profit was $36.3 million in 2007, compared with
$30.6 million in 2006. While our service margins slightly improved, revenue
growth drove segment profitability for the quarter and six-month periods.
Financial Condition, Liquidity & Capital Resources
Our principal source of liquidity remained our cash, cash equivalents
and marketable securities of $1,319.0 million as of the end of the second
quarter of 2007, which increased by $17.3 million during the quarter and
$18.9 million since year-end 2006. The increase in the second quarter was
driven by cash from operating activities of $32.3 million, partially offset
by cash used for purchasing capital equipment. The year-to-date increase
reflects an increase of cash from operating activities of $59.8 million.
During the second quarter of 2007, we repurchased 0.9 million shares of
our common stock at a cost of $10.0 million. On a year-to-date basis, we
repurchased 3.3 million shares of our common stock at a cost of $35.2
million.
Tellabs' Board of Directors and management are assessing our stock
repurchase programs. We provide no assurance that we will continue or
change our repurchase activity, and we cannot estimate the timing of any
such change or the impact on our cash, cash equivalents and marketable
securities.
We believe that the current level of working capital, particularly cash
and marketable securities, is sufficient to meet our normal operating
requirements for the foreseeable future. Further, we believe that
sufficient resources exist to support our future growth and strategic
needs. Future available sources of working capital include cash-on-hand,
cash generated from future operations, short-term or long-term financing,
equity offerings or any combination of these sources. Our current policy is
to retain our earnings to provide funds to enhance stockholder value by
continuing to expand our business and support our operating activities. We
may also utilize our funds for the repurchase of our common stock. We do
not anticipate paying a cash dividend in the foreseeable future.
TELLABS, INC.
CONSOLIDATED NON-GAAP STATEMENTS OF INCOME (1)
(Unaudited)

Second Quarter Six Months
In millions, except per-
share data 6/29/07 6/30/06 Change 6/29/07 6/30/06 Change
Revenue
Products $469.0 $500.6 $879.0 $974.7
Services 65.5 48.7 107.4 89.3
534.5 549.3 -2.7% 986.4 1,064.0 -7.3%
Cost of Revenue
Products 306.3 264.1 538.8 505.8
Services 39.2 29.4 71.2 58.7
345.5 293.5 610.0 564.5

Gross Profit 189.0 255.8 -26.1% 376.4 499.5 -24.6%

Gross profit as a
percentage of revenue 35.4% 46.6% -24.1% 38.2% 46.9% -18.7%

Gross profit as a
percentage of revenue -
products 34.7% 47.2% -26.6% 38.7% 48.1% -19.5%
Gross profit as a
percentage of revenue -
services 40.2% 39.6% 1.3% 33.7% 34.3% -1.6%

Operating Expenses
Research and development 82.4 86.3 163.8 174.5
Sales and marketing 42.8 42.7 87.0 85.6
General and
administrative 22.8 24.3 47.4 47.8
148.0 153.3 298.2 307.9

Operating Earnings 41.0 102.5 78.2 191.6

Other Income
Interest income, net 13.4 11.4 25.2 21.9
Other income (expense),
net 0.3 (2.8) 0.6 (1.4)
13.7 8.6 25.8 20.5

Earnings Before Income Tax 54.7 111.1 104.0 212.1
Income tax expense (16.4) (38.0) (31.2) (73.8)
Net Earnings $38.3 $73.1 $72.8 $138.3


Net Earnings Per Share
Basic $0.09 $0.16 $0.17 $0.31
Diluted $0.09 $0.16 $0.16 $0.30

Weighted Average Shares
Outstanding
Basic 438.1 447.7 438.1 448.8
Diluted 443.3 458.5 443.2 459.6


(1) In addition to reporting financial results in accordance with
generally accepted accounting principles, or GAAP, Tellabs, Inc.
provides non-GAAP statements of income as additional information for
its operating results. These measures are not in accordance with, or
an alternative for, GAAP and may be different from measures used by
other companies. The non-GAAP statements of income eliminate certain
items of expenses and losses from cost of revenue, operating expenses
and other income. The Company's management believes that this
presentation allows investors to evaluate the current operational and
financial performance of the Company's core business as an indicator
of future operational and financial performance. The Company's
management uses these measures for reviewing its financial results
and for business planning and performance. Tellabs, Inc.'s management
discloses this information externally along with a complete
reconciliation of their comparable GAAP amounts, to provide access to
the detail and general nature of adjustments made to GAAP financial
results. Furthermore, while some of these items have been
periodically reported in Tellabs, Inc.'s statements of income,
including significant restructuring and other charges, their
occurrence in future periods is dependent upon future business and
economic factors, among other evaluation criteria, and may frequently
be beyond the control of management.

See the following schedule disclosing the adjustments made to the above
non-GAAP statements of income.


Tellabs, Inc.
Reconciliation of Non-GAAP Adjustments
(Unaudited)

Second Quarter 2007(a) Six Months 2007(b)
In millions, except As Adjust- As Adjust-
per-share data Reported ments Non-GAAP Reported ments Non-GAAP
Cost of Revenue $346.9 ($1.4) $345.5 $612.9 ($2.9) $610.0

Gross Profit 187.6 1.4 $189.0 373.5 2.9 376.4

Operating Expenses 160.1 (12.1) $148.0 322.6 (24.4) 298.2

Income Tax Expense (11.6) (4.8) ($16.4) (21.6) (9.6) (31.2)

Net Earnings $29.6 $8.7 $38.3 $55.1 $17.7 $72.8

Earnings Per Share -
Basic $0.07 $0.02 $0.09 $0.13 $0.04 $0.17
Earnings Per Share -
Diluted $0.07 $0.02 $0.09 $0.12 $0.04 $0.16


Second Quarter 2006(c) Six Months 2006(d)
As Adjust- As Adjust-
Reported ments Non-GAAP Reported ments Non-GAAP
Cost of Revenue $295.1 ($1.6) $293.5 $567.5 ($3.0) $564.5

Gross Profit 254.2 1.6 255.8 496.5 3.0 499.5

Operating Expenses 174.3 (21.0) 153.3 347.3 (39.4) 307.9

Other Income 4.0 4.6 8.6 15.9 4.6 20.5

Income Tax Expense (30.4) (7.6) (38.0) (59.2) (14.6) (73.8)

Net Earnings $53.5 $19.6 $73.1 $105.9 $32.4 $138.3

Earnings Per Share -
Basic $0.12 $0.04 $0.16 $0.24 $0.08 $0.31
Earnings Per Share -
Diluted $0.12 $0.04 $0.16 $0.23 $0.07 $0.30

Note: Equity-based compensation expense includes restricted stock and
performance stock units granted after June 30, 2006
and stock options.

(a) The $1.4 million charge to Cost of Revenue reflects equity-based
compensation.

The $12.1 million charge to Operating Expenses reflects $6.4
million for equity-based compensation and $5.7 million for
amortization of purchased intangible assets.

(b) The $2.9 million charge to Cost of Revenue reflects equity-based
compensation.

The $24.4 million charge to Operating Expenses reflects $13.1
million for equity-based compensation and $11.3 million for
amortization of purchased intangible assets.

(c) The $1.6 million charge to Cost of Revenue reflects equity-based
compensation.

The $21.0 million charge to Operating Expenses reflects $9.9 million
for equity-based compensation, $7.1 million for amortization of
purchased intangible assets, $2.0 million for amortization of
deferred compensation related to acquisitions and $2.0 million for a
restructuring plan to reduce our U.S. workforce to better align our
resources with our current financial operating model.

The $4.6 million charge to Other Income reflects losses on the
writedown of a long-term equity investment.

(d) The $3.0 million charge to Cost of Revenue reflects equity-based
compensation.

The $39.4 million charge to Operating Expenses reflects $19.2 million
for equity-based compensation, $14.1 million for amortization of
purchased intangible assets, $4.1 million for amortization of
deferred compensation related to acquisitions and $2.0 million for a
restructuring plan to reduce our U.S. workforce to better align our
resources with our current financial operating model.

The $4.6 million charge to Other Income reflects losses on the
writedown of a long-term equity investment.


India Ringing


July 24th, 2007 - by Sheetal Guliani

rural-india-mobile.jpgThe Indian Telecom market is amongst the largest in the world and 2nd among emerging economies in Asia with an estimated 5-6 million subscribers being added every month.

Indian telecom is more than 160 years old, beginning with commissioning of the first telegraph line between Kolkata and Diamond Harbour in 1839. Reforms in the Indian Telecom sector began in the 1980s when equipment manufacturing was opened to private players and the Centre for Development of Telecommunication (DOT) was established for the development of indigenous technologies. It was in 1986 that DOT was converted into two wholly owned Government bodies like Mahanagar Telephone Nigam Limited (MTNL) and Videsh Sanchar Nigam Limited (VSNL) were set up. In 1997, Telecom Regulatory Authority of India created.

With the coming into force of the National Telecom Policy (NTP) in 1994 and the New Telecom Policy in 1999, the telecom industry was heading towards a significant change. Now comes 2000, when DOT was renamed Bharat Sanchar Nigam Limited (BSNL). BSNL is today India’s leading telecommunications company and the largest public
sector undertaking.

Within around a decade now India has emerged as one of the largest and high potential telecom sectors in the world and the Indian telecom market now is in the third place after China and the US.

Current scenario:

1. Telecom Sector in India is dominated by two leading players. Reliance and Bharti Airtel being the leaders.

2. Lowest tariffs in the world: air-time rates (Local calls) : From 7 years back when the incoming and outgoing call charges were Rs18/minute (0.45 USD) to today when incoming calls are free and outgoing are charged as low as Rs 1/minute (0.02 USD)

3. International call charges: Calling out of India, one had to think twice as the charges were extravagant to say the least. You would pay upto Rs 75/minute (1.86 USD) to make a call to the US whilst today this is down to Rs 6/minute (0.15 USD)!

4. In the urban areas almost every person from a street vendor to a college student or a house cleaner has one mobile phone at least. Currently, the number of fixed and mobile phones in New Delhi equals 93% of the city’s population.

5. Handset prices are falling rapidly. Handset financing schemes are abundantly available.

6. Under easy payment plans among others such as Airtel’s Rs 495 (12.29 USD), you can get a lifetime incoming call for free!!

7. India is emerging as telecom manufacturing hub.

A quick look:

Subscribers: Jan 2007 (Million)

Fixed : 40.82
Mobile : 178.00
Internet : 8.5
Broadband: 2.0

The story so far:

1 The ‘licensing by circles’ policy initially not considered a great act on the part of the government has now been credited with establishing a highly competitive and healthy telecoms market with immense growth potential.

2. A large number of MNCs like British Telecom, AT&T, and others had “flown” away from India during the last decade or so. Some of the local companies too could not stand the test of competition and took a back seat. But one player never did want to stay away from India and this was Vodafone, which had also exited the Indian market earlier on, but on winning the bid of $ 18.8 billion for Hutchison-Essar, it was back with full force.

3. India’s Internet sector represents a significantly untapped market. A large number of households don’t have access to internet. Many in the country still consider having a PC and internet at home expensive!! Further there are affordable internet cafes effecting the rapid growth of internet in the country. With ‘Cable TV providing Indians one shop stop package, there seems no justification for them to have separate connections at home.

Use of broadband in India has been sluggish around 2 million only inspite of the growth in Internet over the years. The government as a measure to promote the use of broadband has declared 2007 as the year of Broadband in India.

4. At present just about 2% rural households have access to telephones. India’s rural sector, constituting 70% of its entire population, is where the growth of its telecom sector in the future lies. The service providers are moving ahead with their ambitious plans for mobile phones for the rural sector.

5. While GSM technology has continued to be dominant in the country’s mobile market, Tata and Reliance are main players of the CDMA market. CDMA has been increasing its market share and had grabbed a 30% share by early 2007.

We share with you the excerpts of an interesting report from Credit Suisse Bank in the Asian Daily this month on the Indian Telecom Sector.

1. Reliance’s announced GSM expansion plan was widely considered as a first step towards the demise of CDMA in India. 2. The key challenges that faced the CDMA operators in 2006 were uncompetitive low –end handsets pricing and decline in number of handset vendors are being addressed. The ramp of QCOM’s single chip (Qsc) platform and increased competition from new Chinese and Korean vendors have driven handset prices below US $30 thus reducing the differences between lowest priced CDMA handset and lowest price GSM handset to US $ 1

2. Given improving economies and significantly lower churn rates than GSM operators Reliance is more likely to continue to invest in CDMA inspite of expansions in GSM presence. It recently indicated a significant increase in its CDMA capex. On the other hand the Bank is positive on the GSM players to move towards handset bundling.

3. The progress of 3G recommendations is limited due to government approval and lack of spectrum. For security reasons there has been no change in spectrum release and would take early 2008 for 3G licenses to be issued. On the other hand due to increasingly aggressive 3G efforts from major mobile operators indicates that widespread network deployments would quickly follow license grants.

4. The overall mobile growth in India seen as an up 43 percent YOY. Ongoing improvements in network coverage and low end handset pricing would drive the market upwards significantly in next three to five years.”

India is and will remain one of the worlds most dynamic and promising telecom markets for the next five years, and is expected to surpass China in terms of market vitality. The number of mobile phone users in India has grown at over 6 million per month over the past few months, compared to 5 million per month in China. India is the only country rivaling China in terms of subscriber growth these days. According to the reports:

1. China and India will be the world’s largest mobile phone markets by 2010, accounting for a combined 30 per cent of all mobile users in the world. (In 2006, China’s telecom penetration was three times that of India and China’s telecom revenues reached US$83 billion i.e. four times that of India.)

2. India has real expertise in telecom services, and China has inherent strengths in manufacturing and technology.

India and China will be the top two markets worldwide in terms of annual mobile net additions by 2008, with between 64 million and 70 million new subscribers, followed by Russia, the US and Brazil.

……. And it goes without saying that this increased user base will help in further strengthening the already vibrant economies of these two countries.

The Coming of the Consumaholics!

India is undergoing an unprecedented consumption boom. Indian consumers have never felt better before. They are confident shopping as they are contended on major fronts such better job prospects, easy loans and increasing salaries.

The International Marketing firm, ACNielsen conducted an international survey covering 47 countries to study Consumer Confidence and Opinions. The results for the first half of 2007 shows India as the topper for the 5th consecutive year scoring 135 points while the global average was just 97. The figure has been in line with India’s booming economy reported to be at an 18 years all time high at 9.4% last month. China was at 99 just close to the average figures. Below is a bar diagarm depicting trends in the Consumer Confidence Index in 2006 and for first half of 2007.

More on this can be read at http://www.business-standard.com/common/storypage.php?autono=291308&leftnm=6&subLeft=0&chkFlg=

According to the survey,

- 93 % of the Indian consumers felt that their job prospects in the next 12 months were excellent or good

- 90 % thought great about their personal finances in the next 12 months

- 61 % consider it the right time buy things that they ever wanted, and

- 53 % of Indians wanted to invest in shares of stock or mutual funds

The urban middle class in China and India are spending on durables, home decoration, clothes, mobiles, cars, equity investments, and travel and latest gadgets. A third of Chinese consumers and one fifth of Indians say clothes shopping is their favorite thing to do.

India has never seen so many shopping outlets that it has in the last 4 years. Indians were (had to be) contended with Kiranas (little family owned grocery shops and there are millions & millions of them) when it came to buying dailies and for clothing and accessories there were a few branded outlets. Shopping was an eventful activity mainly on dedicated shopping streets, often open to the vagaries of the weather, sweating it out in Janpath or Karol Bagh in New Delhi or Crawford market & Linking Road in Mumbai. Each Locality within Delhi still has a weekly Bazar and they sell everything you ever wanted. Its like an open shopping complex. Even until 2002-3 we didn’t have many reasonable sized shopping malls. Today there has been an explosion of supermarkets and hypermarkets in India with modern retailers coming in to serve the “new” consumer.

According to a survey about 32 percent of Indians go for shopping once a month where as 22 percent of them indulge in it once a week. Both in China and India mobile phones and cars is almost a status symbol. I believe the rise in Confidence levels in the Indian Consumer (similar in China in many ways) can be attributed to

1. Higher salaries and expectations of its increase with regard to rapid high growth in the economy

2. Increase in double income families

3. One and two leading to higher affordability and disposable incomes.

4. Significantly better job prospects.

5. Easy access to variety of branded goods (The word branded was earlier connected with gifts from foreign relatives visiting us in India in summer holidays)

6. Change in fashion and trends following the more developed countries – obviously is attributed to higher dispensable incomes

7. Increased competition from international players and growing domestic market thus lowering down prices thereby bringing goods within reach of the middle class

8. Loans on easy terms thus moderating the ideology of every Indian household to “save & Invest” only

9. Concept of shopping in multiplexes being new and they are loving the “discovery”. These malls are more than just about buying. They are entertainment hubs and millions of Indians living in congested accommodations find themselves easing out in a one stop shop with movies, food courts, and clothing outlets.

To conclude: The consumer in India and China is changing rapidly. The young middle class, below 30 years and constituting majority of their population are aspirational of their needs, ambitious, hard working and have money to spend on trends. They are brand-conscious and aware of what the West is doing in fashion and style, making shopping almost a national pastime.